BIS international – The BIS locational banking statistics (LBS) show that banks’ cross-border claims expanded by $782 billion during the second quarter of 2022 (+8% year-on-year (yoy)) on an FX- and break-adjusted basis (Graph 1.A).2
This expansion was driven by an outsize rise in the market value of derivatives (+$515 billion), especially those reported by banks in the euro area, against the backdrop of elevated uncertainty and market volatility (yellow bars).
Excluding derivatives and other residual claims, the Q2 increase in bank credit – ie loans and holdings of debt securities – was more modest, at $100 billion (+6% yoy).3
Graph 1
Close all
Click here for an interactive version of this graph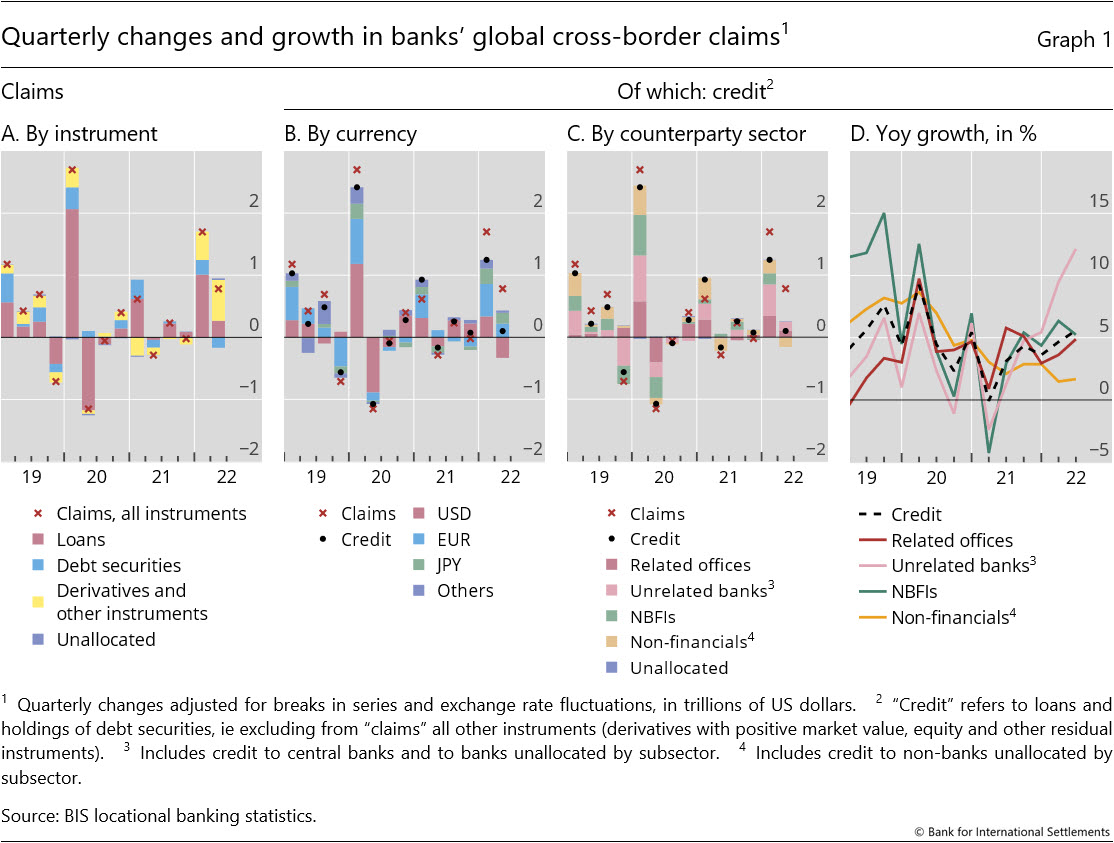
Market value of derivatives surged amidst market uncertainty
The market value of banks’ cross-border derivatives positions surged in the second quarter (Graph 1.A).
Part of this increase reflected greater inter-office derivatives claims (+$190 billion), especially those denominated in euros and reported by banks in the euro area.
This can arise when risks associated with derivatives portfolios are transferred across trading desks within the same consolidated banking group.
In addition, cross-border derivatives claims vis-à-vis unaffiliated counterparties rose substantially, resulting in an overall jump in derivatives by $515 billion in Q2, more than half vis-à-vis counterparties in the United Kingdom.
The BIS consolidated banking statistics (CBS), which track the consolidated positions of banks headquartered in a particular country, net of inter-office positions, suggest that these developments reflect elevated uncertainty and market volatility.
Russia’s invasion of Ukraine and changing expectations about the future path of monetary policy in major currencies led to sharp movements in the prices of financial instruments, pushing derivatives contracts “into the money” for either the reporting banks or their counterparties.4
Derivatives with a positive market value reached $3.8 trillion by end-June (Graph 2.A), up 30% from end-2021, while those with a negative market value moved in tandem.
Many reporting banks are market-makers recording large but offsetting derivatives positions on their balance sheets (Graph 2.B).
Graph 2
Close all
Click here for an interactive version of this graph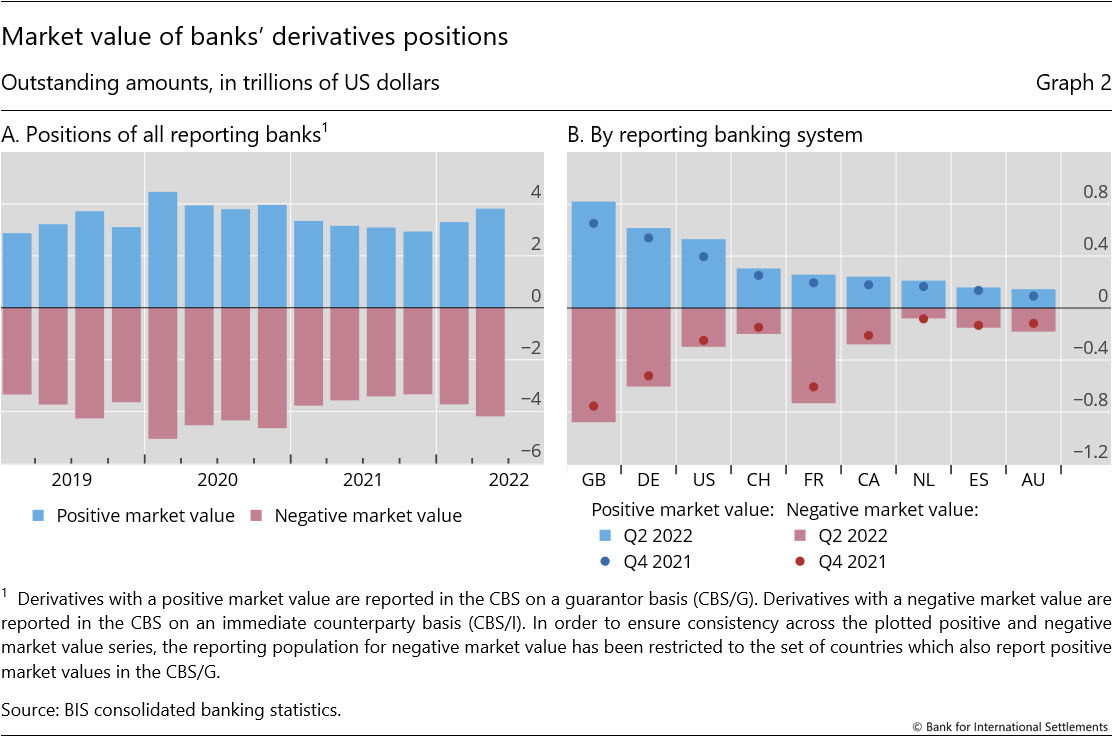
Growth in cross-border bank credit muted in Q2
At $100 billion, the Q2 expansion in cross-border bank credit (ie bank loans plus holdings of debt securities) was much smaller than that in claims overall.
Credit was driven by greater interbank positions, mainly denominated in euros and yen. Interbank credit rose by $250 billion overall, partly in the form of inter-office transfers (+$105 billion).
By contrast, credit to other sectors either declined (-$154 billion to the non-financial sector), or stagnated (-$4 billion to non-bank financial institutions (NBFIs)) (Graph 1.C).
Using annual growth to look through the seasonal patterns shows that the growth rate of cross-border credit rose to 6% yoy, from 5% in Q1 (Graph 1.D).
Cross-border credit to advanced economies (AEs) rose modestly overall (+$66 billion in Q2, +7% yoy).
Stronger bank lending was partly offset by a drop in the reported value of debt securities holdings.
Global banks reported greater credit to the United Kingdom (+$62 billion) and a drop vis-à-vis the United States (-$141 billion), partly reflecting the accounting practice of some banks of reappraising securities from market value in Q1 back to book value in Q2 (Graph 3).
Graph 3
Close all
Click here for an interactive version of this graph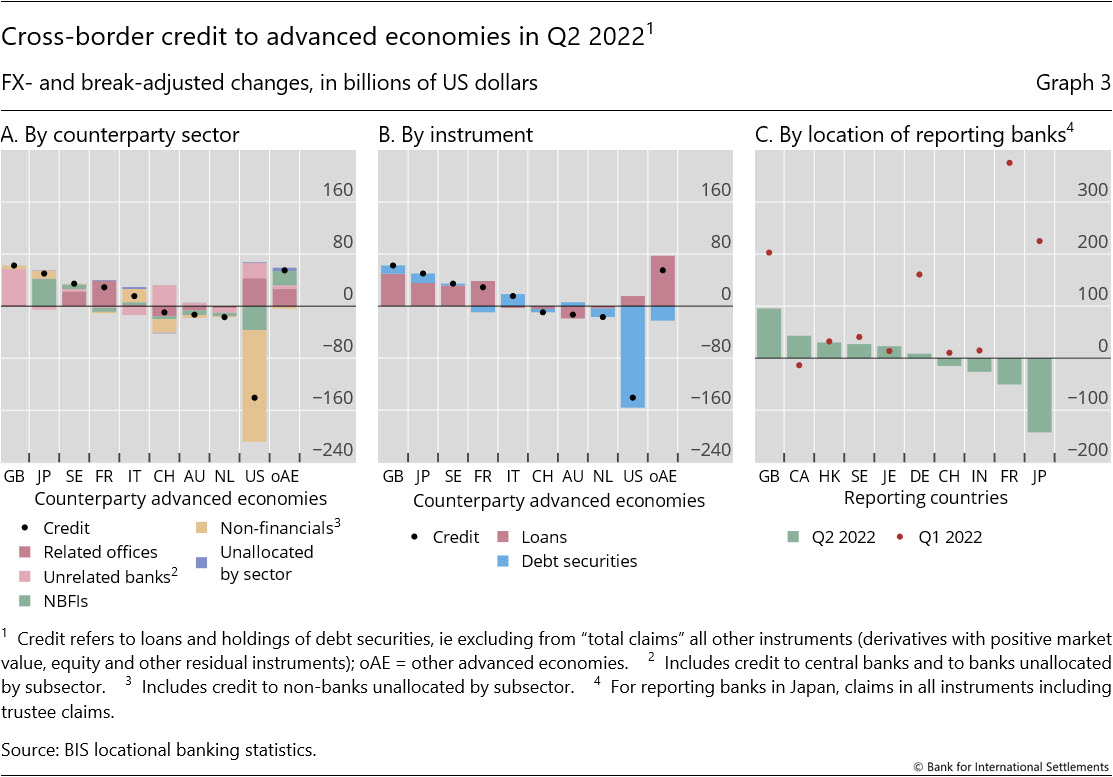
Credit to EMDEs up despite drops vis-à-vis key economies
Banks’ cross-border credit to emerging market and developing economies (EMDEs) increased by $28 billion overall in Q2 (+2% yoy), but with large differences within regions (Graph 4.A).
Credit to many countries in Latin America rose, but the $14 billion drop in credit to Brazil resulted in an overall drop of $5 billion to the region (Graphs 4.A and B).
Credit to Africa and the Middle East rose by $19 billion, extending a long spell of increases since 2014, particularly to countries in the Middle East.
Credit to emerging Asia-Pacific expanded by $8 billion, despite continued retrenchment from China – by $23 billion in Q2, leading to a cumulative decline of $114 billion over the past year (-12%).
Mainly Chinese banks operating outside China continued to reduce their claims on the mainland (Graph 4.C).
In the rest of the Asia-Pacific region, credit to Korea expanded the most (+$21 billion), followed by Pakistan and Indonesia.
The CBS shed more light on how banking systems’ exposures to China have evolved recently.
Non-Chinese banks’ foreign claims on China fell by $32 billion in Q2 2022, or by $68 billion over one year (-7%) (Graph 5.A).5
Their claims on banks in China declined the most, followed by claims on the official sector (Graph 5.B).
Separately, foreign banks’ other potential exposures to China fell by $26 billion (Graph 5.C).
Graph 4
Close all
Click here for an interactive version of this graph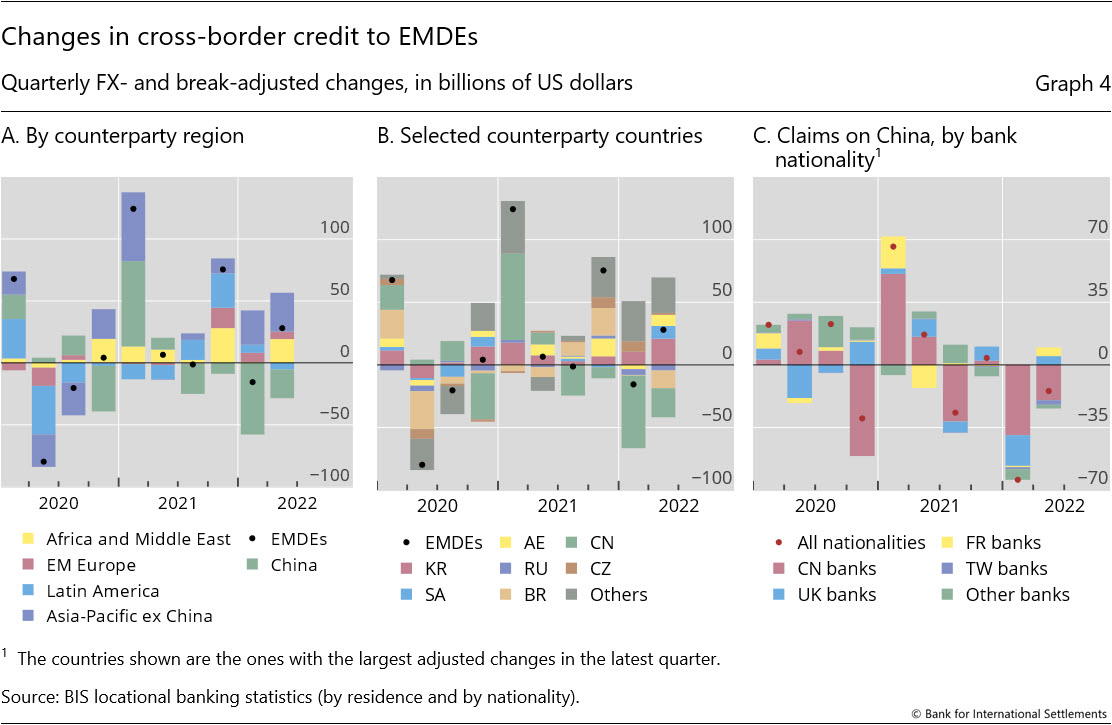
Graph 5
Close all
Click here for an interactive version of this graph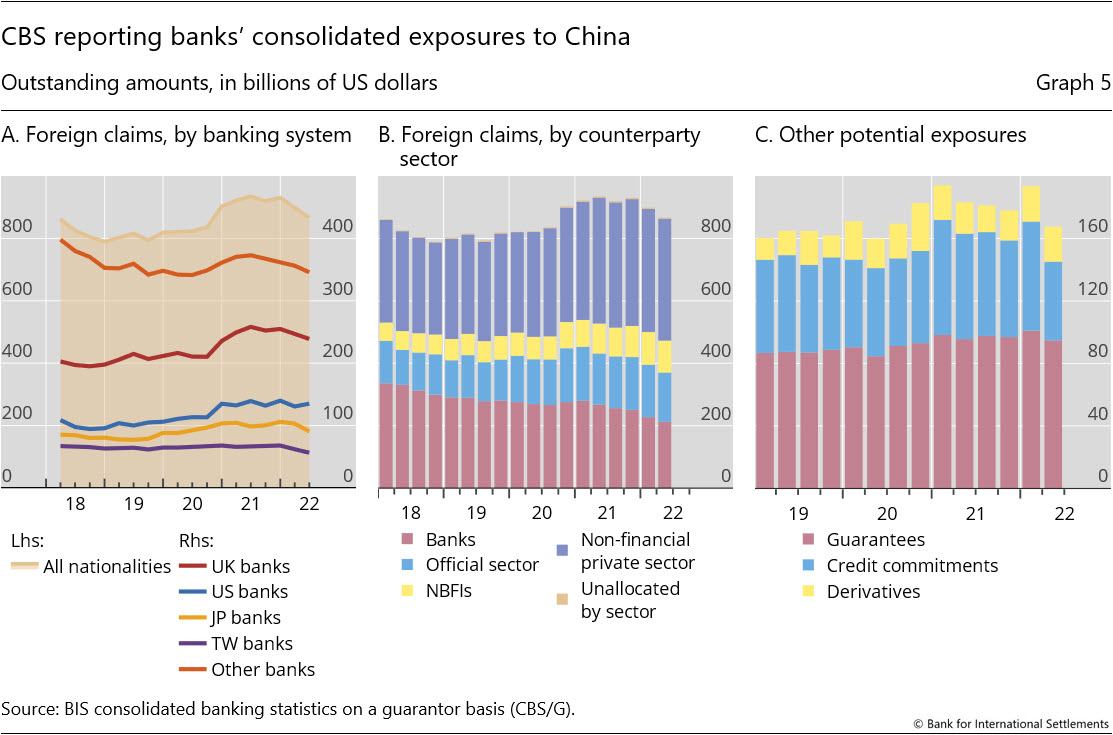
Emerging Europe continued to attract cross-border credit in Q2 (+$6 billion) (Graph 4.A).
Over the past year, the region received credit amounting to $29 billion (+7%), of which Czechia accounted for the bulk ($20 billion), followed by Hungary (+$8 billion) and Poland (+$5 billion), while credit to Turkey had fallen by $3 billion.
In the latest quarter, Poland, Turkey and Czechia each attracted more than $1.5 billion in new bank credit.
Banks in most countries continued to reduce cross-border credit to Russia, but some reported a surge in liabilities to Russia (Graph 6.A).
Banks reduced their cross-border credit to borrowers in Russia by $4.5 billion, following a similar decline in Q1 (red bars).6 At the same time, they recorded a surge in cross-border liabilities: the $74 billion increase was the largest on record, with the bulk accounted for by liabilities to the Central Bank of the Russian Federation following western sanctions.
For example, Euroclear Bank publicly reported a €72 billion rise in liabilities at the end of June 2022 that resulted from the accumulation of blocked coupon payments and redemptions on its balance sheet.7
BIS reporting banks’ net cross-border liabilities (liabilities minus claims) to Russia thus doubled in Q2 alone, to $147 billion (Graph 6.A, black line).
Graph 6
Close all
Click here for an interactive version of this graph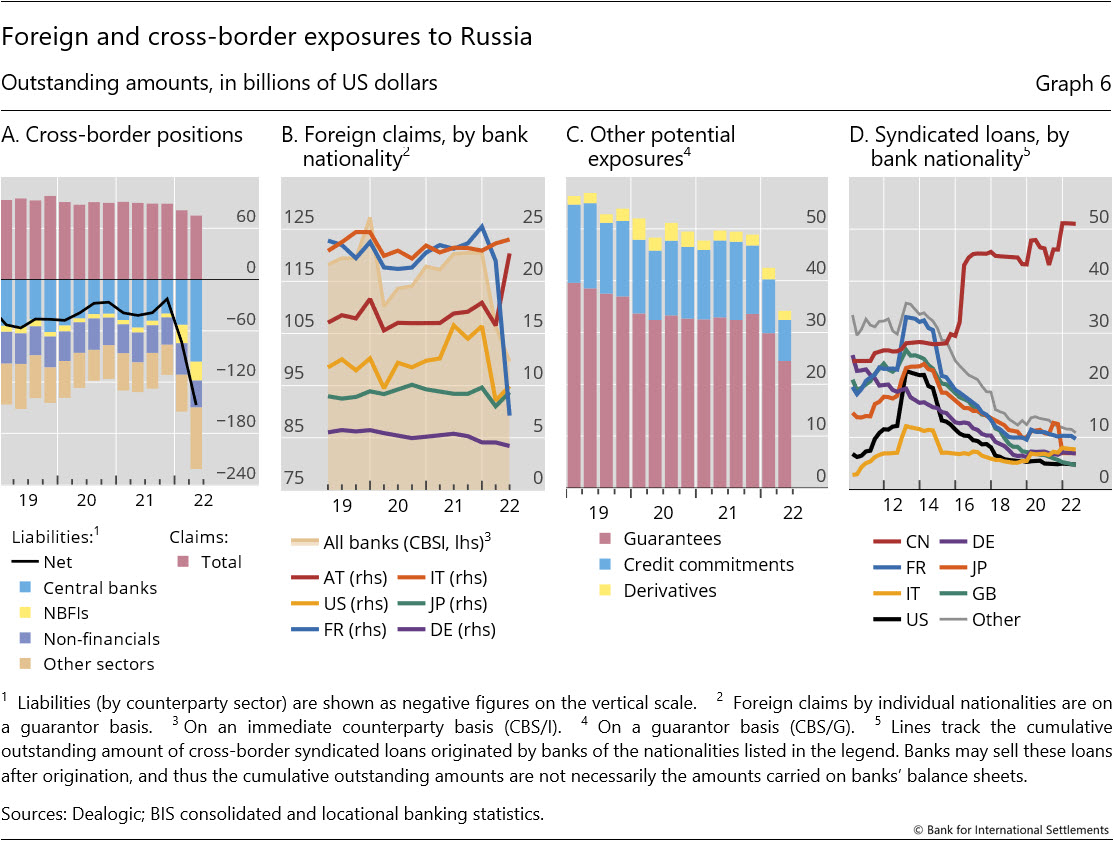
The CBS provide a more comprehensive view of banks’ consolidated exposures to Russia and how they have evolved since early 2022.
Reporting banks’ combined foreign claims on Russia fell by $7 billion in Q2 to $100 billion, following a drop of $14 billion in Q1 (Graph 6.B).8 The drop was due to French banks (-$15 billion).9
The positions of other banking systems remained broadly stable, while claims of Austrian banks actually rose by $7 billion as the rouble recovered 30% of its value in Q2. Banks’ other potential exposures to Russia continued to decline (Graph 6.C).
While Chinese authorities do not report the CBS, other data sources suggest that Chinese banks may have maintained or stepped up their credit to borrowers in Russia in the first three quarters of 2022 (Graph 6.D).
For instance, outstanding syndicated loans derived from Dealogic data show that loans originated by Chinese banks up to September 2022 remained high at $51 billion, accounting for over 40% of the global total of syndicated loans to Russia.
These developments echo those seen in the mid-2010s, as Chinese banks expanded their syndicated loans to Russia following a retreat by banks from other countries after the imposition of sanctions on Russia in 2014.
Global liquidity indicators at end-June 2022
The BIS global liquidity indicators (GLIs) track credit to non-bank borrowers, covering both loans extended by banks and funding from global bond markets through the issuance of international debt securities (IDS).
The main focus is on foreign currency credit denominated in three major reserve currencies (US dollars, euros and Japanese yen) to non-residents, ie borrowers outside the respective currency areas.
The GLIs monitor growth in this credit relative to that denominated in those same currencies to residents within these currency areas (as reported in national financial accounts).10
In Q2 2022, foreign currency credit denominated in US dollars contracted while that in euros expanded. As a result, yoy growth rates diverged further (Graph 7.A).
Dollar credit to non-bank borrowers outside the United States stood at $13.3 trillion at quarter-end, only 1% higher than a year earlier (Annex Graph C.4).
Growth in euro credit to non-bank borrowers outside the euro area remained strong at 10% yoy, pushing the amount outstanding to €3.9 trillion ($4.1 trillion).
Yen credit to non-bank borrowers outside Japan accelerated to 10% yoy through a jump in bank loans (16% yoy) (Graph 7.B).
Increased yen lending, by both Japanese and other banks, pushed the stock of credit to ¥49.8 trillion ($0.37 trillion). In all three currencies, the issuance of IDS slowed down (Graph 7.C).
Graph 7
Close all
Click here for an interactive version of this graph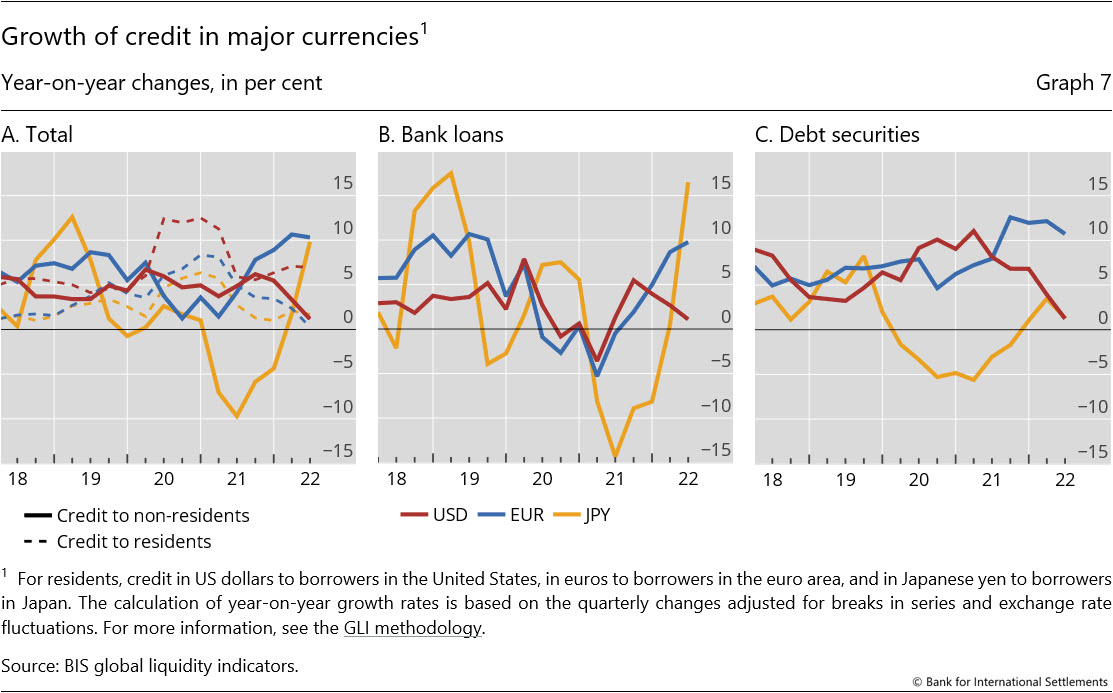
Foreign currency credit to non-banks in emerging market and developing economies (EMDEs) also weakened in dollars but accelerated in euros (Graph 8.A).
This left the respective stocks at $4.2 trillion (Table E2-USD) and €0.8 trillion (Table E2-EUR). Dollar credit to EMDEs declined by $7 billion during Q2 2022 after six consecutive quarterly expansions (Graph 8.B).
Dollar credit to non-banks in Asia-Pacific fell the most (-$13 billion), mainly reflecting lower credit to borrowers in China (-$21 billion), followed by those in emerging Europe (-$3 billion).
By contrast, credit to borrowers in Africa and the Middle East (+$7 billion) and in Latin America (+$2 billion) grew.
In contrast to dollar credit, growth in euro credit to EMDEs gained momentum (Graph 8.C).
Euro-denominated loans grew by €23 billion in Q2, whereas net issuance of IDS (gross issuance minus redemptions) added little.
Borrowers residing in emerging Europe received most of the new euro credit (+€16 billion), followed by Asia-Pacific (+€8 billion).
The only region that saw a contraction was Latin America (-€2 billion), mainly on account of Mexico (-€2 billion).
Graph 8
Close all
Click here for an interactive version of this graph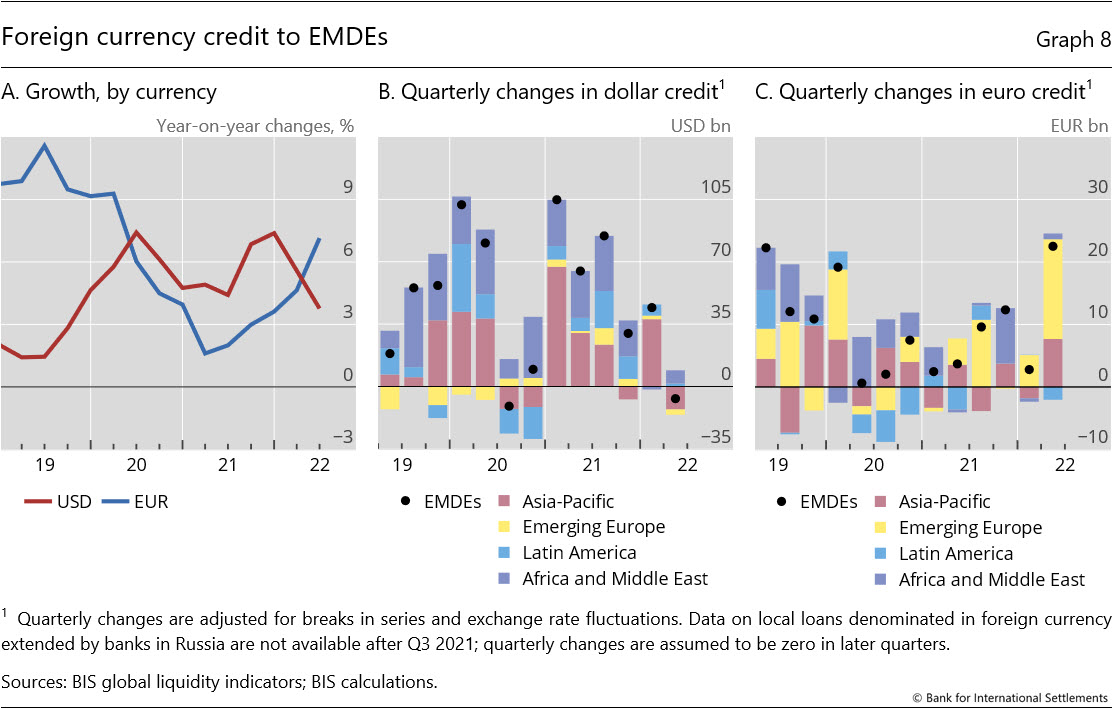
Looking ahead, high inflation and rising interest rates in many jurisdictions may have a significant impact on foreign currency credit to EMDEs and advanced economies (AEs).
Persistent dollar strength can pose balance sheet challenges to dollar borrowers whose assets or revenues are in local currencies.
While the GLI data for Q3 2022 will be available only in January 2023, data from Dealogic can provide timelier (if partial) insights in the meantime.
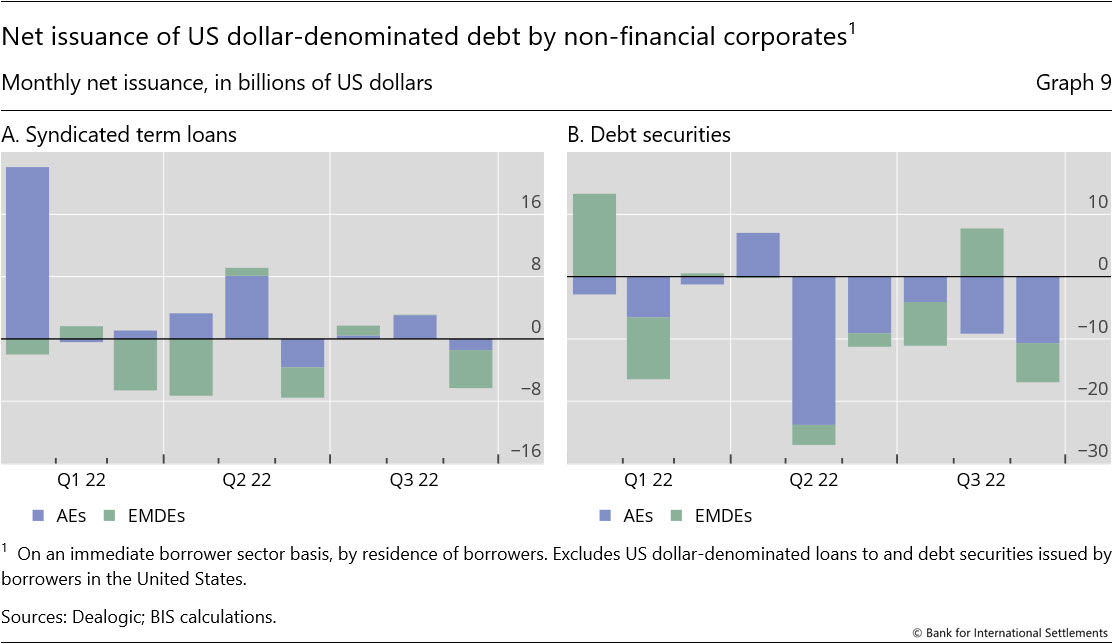
Overall, these data foreshadow a further slowdown of dollar financing in Q3, for bonds as well as for term loans (Graph 9).
Weakness in dollar credit in Q2 continued into the third quarter, especially for debt issuance by non-financial corporates (NFCs) in AEs (Graph 9, purple bars).
Issuance by these firms dropped markedly in Q2 (-$18 billion), and the downward trend in issuance continued into Q3, with July (-$4 billion), August (-$6 billion) and September (-$12 billion) data pointing to further slowdown.
As regards NFCs in EMDEs (green bars), Q3 data suggest a cumulative decline (-$9 billion) in the outstanding stock of dollar debt between July and September.
Graph 9
Close all


