Macro in a Minute
This week saw significant revisions to U.S. GDP data that help explain the resilience of the U.S. economy, along with notable stimulus from the Chinese government that impacted equity and commodity markets.
Today’s annual revisions increased the level of GDP 1.3% above previous reports. Also, real disposable income was revised up 3.5%, pushing up the savings rate to a healthier 5.2% from 3.3%. This revision indicates that the resilience of consumer spending has been supported by real income gains in recent quarters.
While the U.S. economy has fared better than many expected, the ongoing property slump in China has weighed on its economy, putting it on track to miss this year’s 5% growth target. As a result, the Chinese government offered a raft of stimulus measures this week and pledged further fiscal stimulus.
So far, stimulus has included a 20-basis point cut in the central bank’s main policy rate, lowering bank reserve requirements to free up money for lending, along with more than $100 billion to support equity purchases and share buybacks.
As a result, China’s CSI 300 equity index is up 11% in the last week. The move had a modest impact on U.S. markets, with the major indices flat to up 1% in the last week and 10-year Treasury yields up nearly 10 basis points to 3.8%.
Industrial commodities also got a lift from the stimulus news, with Bloomberg’s industrial metals index up 5%. Oil prices bucked the trend, however, falling nearly 5% in the last week on reports Saudi Arabia plans to increase production.
Tomorrow, the focus returns to the U.S. with the release of the Federal Reserve’s preferred PCE inflation data, which will be watched for its potential impact on the Fed’s rate cut path.
The Impact of Elections on the Markets
There have been a lot of large countries with elections this year, but perhaps none will be more watched than the 2024 U.S. presidential election.
Even though the actual election isn’t until Nov. 5, elections can start impacting markets much earlier. That’s because the election cycle begins long before November, and stock markets are good at pricing in future events and revenues.
In your typical election year, there are primaries from January to May, where each state votes on the candidate it wants to represent its party in the election. Then, the candidates are out on the campaign trail before we see debates, often in September and October. Finally, we vote in early November.
Of course, this year has been anything but typical!
We had one unusually early debate in June. Then the top of the Democratic ticket changed in July, with Vice President Harris replacing President Biden.
And we’ve just had our first (and possibly last) presidential debate with the current candidates, with a vice presidential debate still to come.
On Tuesday, Nov. 5, we’ll vote.
Election uncertainty adds to higher volatility (before the election)
With this looking like it will be a close election, we should expect increased volatility.
If we measure equity volatility by the VIX, we see it increases nearly 45% between August and October in close election years (chart below, red bars). Then, with the election results usually known by early November, volatility starts to fall.
Interestingly, when the election isn’t close (green bars), volatility is close to flat throughout the end of the year, reflecting market confidence about who will win.
However, if we look at non-election years, we see that some of this pattern is a seasonal trend. Volatility rises about 15% between August and October (orange bars) in other years, too.
Chart 1: Close elections create uncertainty, driving increased volatility in run up to election

Election certainty adds to higher trading (after the election)
Interestingly, trading actually picks up more after the election, once the election result is known. That shows traders need to rebalance their portfolios to account for the expected sector and stock beneficiaries from the now more certain policy changes ahead.
Still, the impact on volumes changes from election to election. For 2012, volumes peaked about 30% higher than on election day (blue line). But for the last two elections, volumes peaked about 75%-90% higher than on their election days (green and orange lines)!
Chart 2: After the election result is known, trading increases and investors rebalance their portfolios

Elections trading spikes are smaller than for other big events
While these are relatively big increases in volumes in the span of a few days, the increase associated with elections tends to be smaller than other major events.
For example, in the last couple presidential elections, activity – i.e., volumes and message traffic – increased between 58% and 76% (chart below, red bars).
That’s about the same magnitude as the response to the short-lived regional bank crisis in 2023, and the Fed’s pivot to tightening rates in early 2022 (orange bars). Even a largely unexplained selloff in February 2018 saw an increase in activity 2-3x that of the last two elections.
Chart 3: Elections increase activity, but not as much as other major events

Of course, some of this difference comes down to the fact that these other events are typically unexpected, unlike elections.
Election uncertainty tends to lower returns
We’ve already shown that elections, and especially close elections, increase volatility and trading activity. But they also impact returns.
That’s because close elections create uncertainty for investors and markets, since they can’t be confident who will win, or what rules and industries might change.
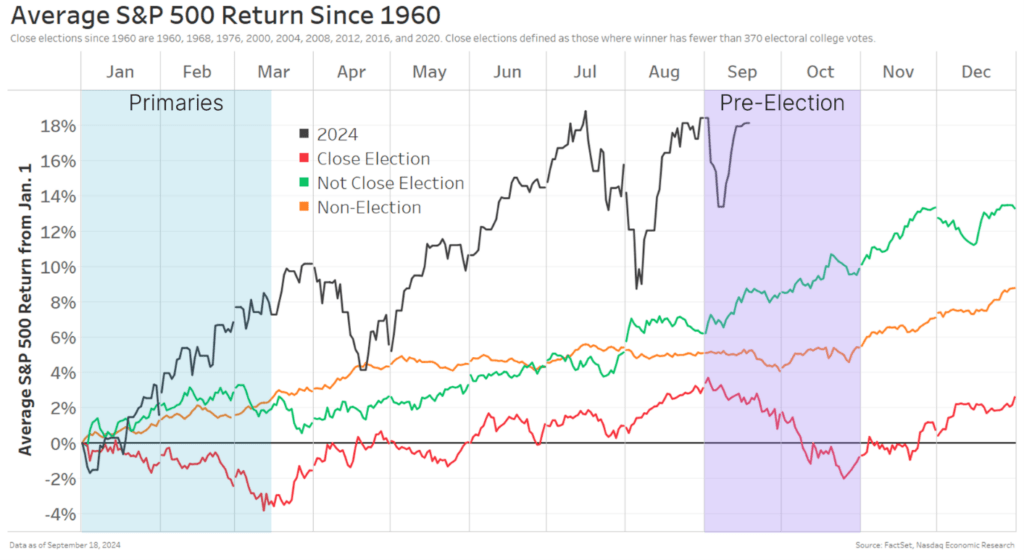
On average, in close elections (chart below, red line), the market:
Sells off through March – the heart of primary season.
Tends to gain once the candidates are narrowed down to two.
Gets more volatile when we get to debate season in September and October, when the election really heats up, often seeing stocks selloff again.
Once the election is decided, though, the market typically rallies through the end of the year, finishing the year up almost 3% – regardless of who wins!
In comparison, non-election years, which don’t have the same level of political uncertainty, see a much more consistent gain, adding to about 9% over the course of the year (orange line).
Chart 4: Close elections see selloff during primaries and again just ahead of election

Although what we’ve seen this year is far from normal (black line). Perhaps what this shows is that, regardless of what happens in an election year, macroeconomics matters.
Economics matters more than who wins
…and that’s true historically, too.
Republicans and democrats might think who wins matters a lot to markets. After all, their policies help shape how the economy works going forward.
However, looking at equity market total returns for each “presidential cycle” (the four years following a president’s election), we see that there’s no clear benefit for things like going from Republican (red bars) to Democrat (blue bars) or vice versa or winning re-election (darker red and blue bars).
Instead, the one clear trend is that the economy matters a lot. In fact, the average total return for terms that overlapped with recession (grey arrows) is 30%, compared to 62% for those that didn’t.
Chart 5: Recessions are biggest driver of returns during a presidency, much more than party
So, much more than who’s in the White House, it’s the economy that matters to markets.
Elections matter to markets, but macro matters, too
If history is a guide, we should be prepared for higher volatility, increased activity and potentially lower returns. At least for short periods this year.
But the data show that macro matters, so investors need to watch the global economy, too. The predicted soft landing and Fed rate cuts this year may be more important than whoever is in the White House in 2025.
Michael Normyle, U.S. Economist at Nasdaq, contributed to this article.


